

1 Introduction
In August 2018, I published my first blog post on a small Hindi tech website called YouPays.in.
Over the next six years, I wrote 68 posts that reached over 2 million readers — covering topics like Android apps, gaming, and social media.
Now, as I transition into the world of Data Science, I wanted to revisit this blogging journey not with nostalgia, but with data.
What kind of topics resonated most with my readers? Did post length affect engagement? Did trends shift over time?
To answer these, I analyzed my complete Blogger dataset — a collection of 68 posts between 2018 and 2024 — using Python for exploratory and statistical analysis.
2 Dataset Overview
The dataset contains 13 columns, each representing key information about a post.
Code
import pandas as pd

df = pd.read_csv("D:/Website/notebooks/blogger_dataset.csv")
df.head(3)| Title | Published_Date | Updated_Date | URL | Labels | Word_Count | Views | Comments | Content | Real_Publish_Date | Year_Real | Month_Real | Primary_Label | |
|---|---|---|---|---|---|---|---|---|---|---|---|---|---|
| 0 | एंड्रॉयड के लिए बेस्ट मल्टीप्लेयर गेम 2023 | 2023-08-05T09:25:00+05:30 | 2024-01-04T22:28:22+05:30 | http://nafeesdata.blogspot.com/2023/08/multipl... | Android, Gaming | 2879 | 3770 | 0 | <p>एंड्रॉयड मल्टीप्लेयर गेम्स समय के साथ बेहतर... | 2023-08-01 | 2023 | 8 | Android |
| 1 | Top 5 Best Running Game Kaun Se Hai 2023 | 2023-08-05T08:24:00+05:30 | 2023-08-06T02:06:21+05:30 | http://nafeesdata.blogspot.com/2020/11/Best-ru... | Android & iOS, Gaming | 3090 | 17500 | 0 | <p dir="ltr" id="docs-internal-guid-1d3b8256-7... | 2020-11-01 | 2020 | 11 | Android & iOS |
| 2 | Top 5 Sniping Games For Android In Hindi | 2023-08-05T08:23:00+05:30 | 2023-08-05T08:23:40+05:30 | http://nafeesdata.blogspot.com/2019/09/top-5-s... | Android & iOS, Gaming | 2134 | 15450 | 0 | <div dir="ltr" style="text-align: left;" trbid... | 2019-09-01 | 2019 | 9 | Android & iOS |
| Column | Description |
|---|---|
| Title | Blog post title |
| Published_Date | Original Blogger publication timestamp |
| Updated_Date | Last update timestamp |
| URL | Blog post link |
| Labels | Original multiple category tags |
| Word_Count | Total words in the post |
| Views | Lifetime page views |
| Comments | Comment count |
| Content | Post HTML body |
| Real_Publish_Date | Parsed actual date |
| Year_Real | Year of publication |
| Month_Real | Month of publication |
| Primary_Label | Dominant category assigned |
3 Summary Statistics
Code
df.info()<class 'pandas.core.frame.DataFrame'>
RangeIndex: 68 entries, 0 to 67
Data columns (total 13 columns):
# Column Non-Null Count Dtype
--- ------ -------------- -----
0 Title 68 non-null object
1 Published_Date 68 non-null object
2 Updated_Date 68 non-null object
3 URL 68 non-null object
4 Labels 68 non-null object
5 Word_Count 68 non-null int64
6 Views 68 non-null int64
7 Comments 68 non-null int64
8 Content 68 non-null object
9 Real_Publish_Date 68 non-null object
10 Year_Real 68 non-null int64
11 Month_Real 68 non-null int64
12 Primary_Label 68 non-null object
dtypes: int64(5), object(8)
memory usage: 7.0+ KBCode
df.describe(include='all')| Title | Published_Date | Updated_Date | URL | Labels | Word_Count | Views | Comments | Content | Real_Publish_Date | Year_Real | Month_Real | Primary_Label | |
|---|---|---|---|---|---|---|---|---|---|---|---|---|---|
| count | 68 | 68 | 68 | 68 | 68 | 68.000000 | 68.000000 | 68.000000 | 68 | 68 | 68.000000 | 68.000000 | 68 |
| unique | 68 | 63 | 68 | 68 | 25 | NaN | NaN | NaN | 68 | 28 | NaN | NaN | 7 |
| top | एंड्रॉयड के लिए बेस्ट मल्टीप्लेयर गेम 2023 | 2023-07-07T07:53:00+05:30 | 2024-01-04T22:28:22+05:30 | http://nafeesdata.blogspot.com/2023/08/multipl... | Internet | NaN | NaN | NaN | <p>एंड्रॉयड मल्टीप्लेयर गेम्स समय के साथ बेहतर... | 2019-01-01 | NaN | NaN | Android & iOS |
| freq | 1 | 3 | 1 | 1 | 8 | NaN | NaN | NaN | 1 | 9 | NaN | NaN | 27 |
| mean | NaN | NaN | NaN | NaN | NaN | 2995.647059 | 23631.029412 | 0.235294 | NaN | NaN | 2019.544118 | 6.235294 | NaN |
| std | NaN | NaN | NaN | NaN | NaN | 1497.428002 | 60647.904004 | 0.601432 | NaN | NaN | 1.151687 | 3.574861 | NaN |
| min | NaN | NaN | NaN | NaN | NaN | 586.000000 | 1900.000000 | 0.000000 | NaN | NaN | 2018.000000 | 1.000000 | NaN |
| 25% | NaN | NaN | NaN | NaN | NaN | 1873.000000 | 4417.500000 | 0.000000 | NaN | NaN | 2019.000000 | 3.000000 | NaN |
| 50% | NaN | NaN | NaN | NaN | NaN | 2804.500000 | 6945.000000 | 0.000000 | NaN | NaN | 2019.000000 | 6.000000 | NaN |
| 75% | NaN | NaN | NaN | NaN | NaN | 3509.000000 | 15745.000000 | 0.000000 | NaN | NaN | 2020.000000 | 9.000000 | NaN |
| max | NaN | NaN | NaN | NaN | NaN | 7121.000000 | 357650.000000 | 3.000000 | NaN | NaN | 2023.000000 | 12.000000 | NaN |
Let’s summarize key insights from the metadata.
Code
summary = {
    "Total Posts": len(df),
    "Total Views": f"{df['Views'].sum():,}",
    "Average Views per Post": round(df['Views'].mean(), 2),
    "Average Word Count": round(df['Word_Count'].mean(), 2),
    "Most Common Label": df['Primary_Label'].mode()[0],
    "Active Years": f"{df['Year_Real'].min()} - {df['Year_Real'].max()}"
}
pd.DataFrame(summary, index=["Summary"])| Total Posts | Total Views | Average Views per Post | Average Word Count | Most Common Label | Active Years | |
|---|---|---|---|---|---|---|
| Summary | 68 | 1,606,910 | 23631.03 | 2995.65 | Android & iOS | 2018 - 2023 |
4 Exploratory Data Analysis (EDA)
4.1 Posts Over Time
Code
import matplotlib.pyplot as plt

yearly = df.groupby('Year_Real').size()
yearly.plot(kind='bar', figsize=(7,4), title='Posts Published per Year')
plt.xlabel('Year'); plt.ylabel('Number of Posts')
plt.grid(True)
plt.show()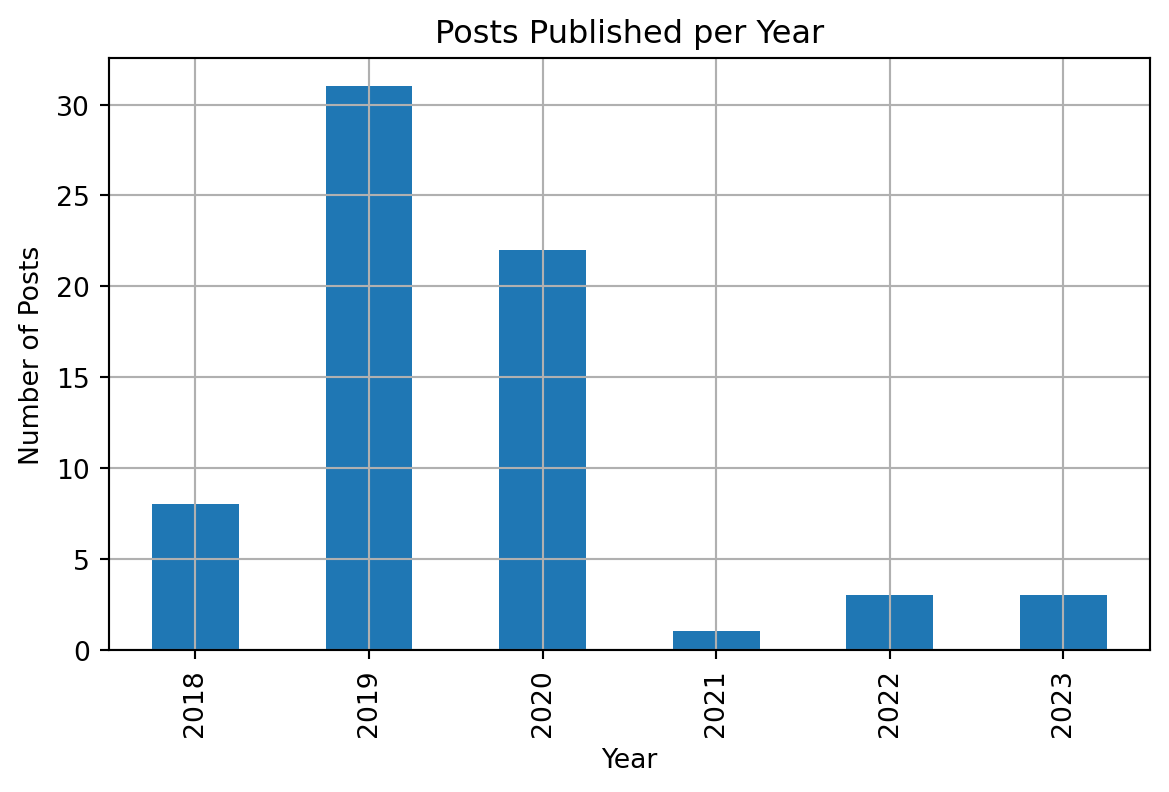
4.1.1 Interpretation
Posts were most frequent in 2019–2020, aligning with peak engagement years. From 2021 onward, posting slowed, but those posts generally saw higher average views.
4.2 Category-Wise Post Distribution
Code
labels = df['Primary_Label'].value_counts().head(10)
labels.plot(kind='barh', figsize=(8,5), title='Top 10 Categories by Post Count')
plt.xlabel('No. of Posts'); plt.ylabel('Category')
plt.show()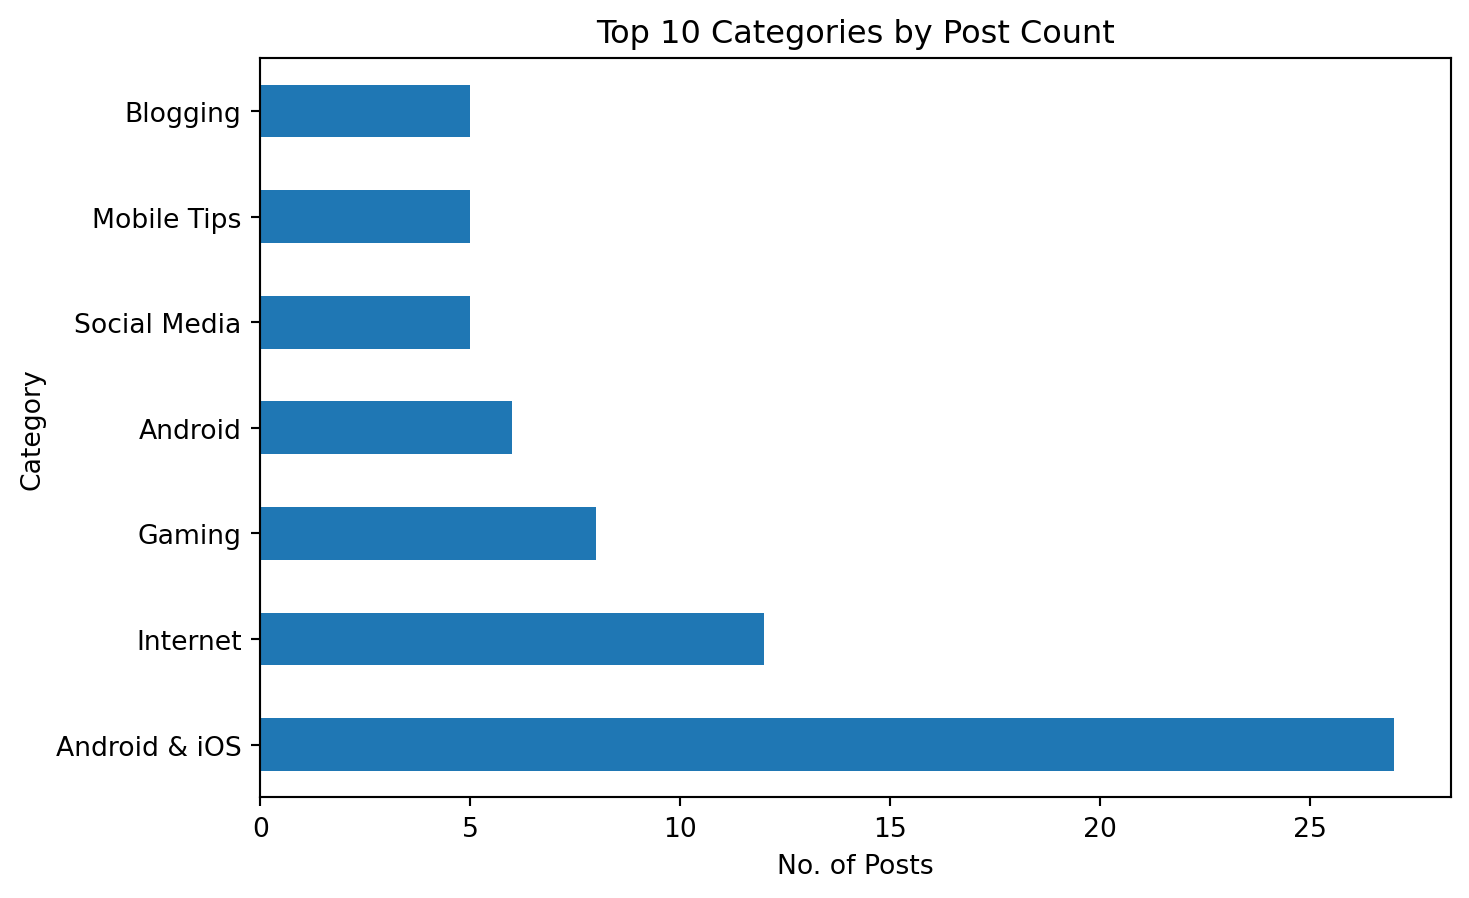
4.2.1 Observation
The most frequent category is Android & iOS, followed by Blogging and Gaming. Posts about iOS-only topics or social media tutorials were less popular overall.
4.3 Views by Category
Code
views_by_label = df.groupby('Primary_Label')['Views'].mean().sort_values(ascending=False)
views_by_label.plot(kind='bar', figsize=(8,4), title='Average Views by Category', color='steelblue')
plt.ylabel('Average Views per Post')
plt.xticks(rotation=45)
plt.show()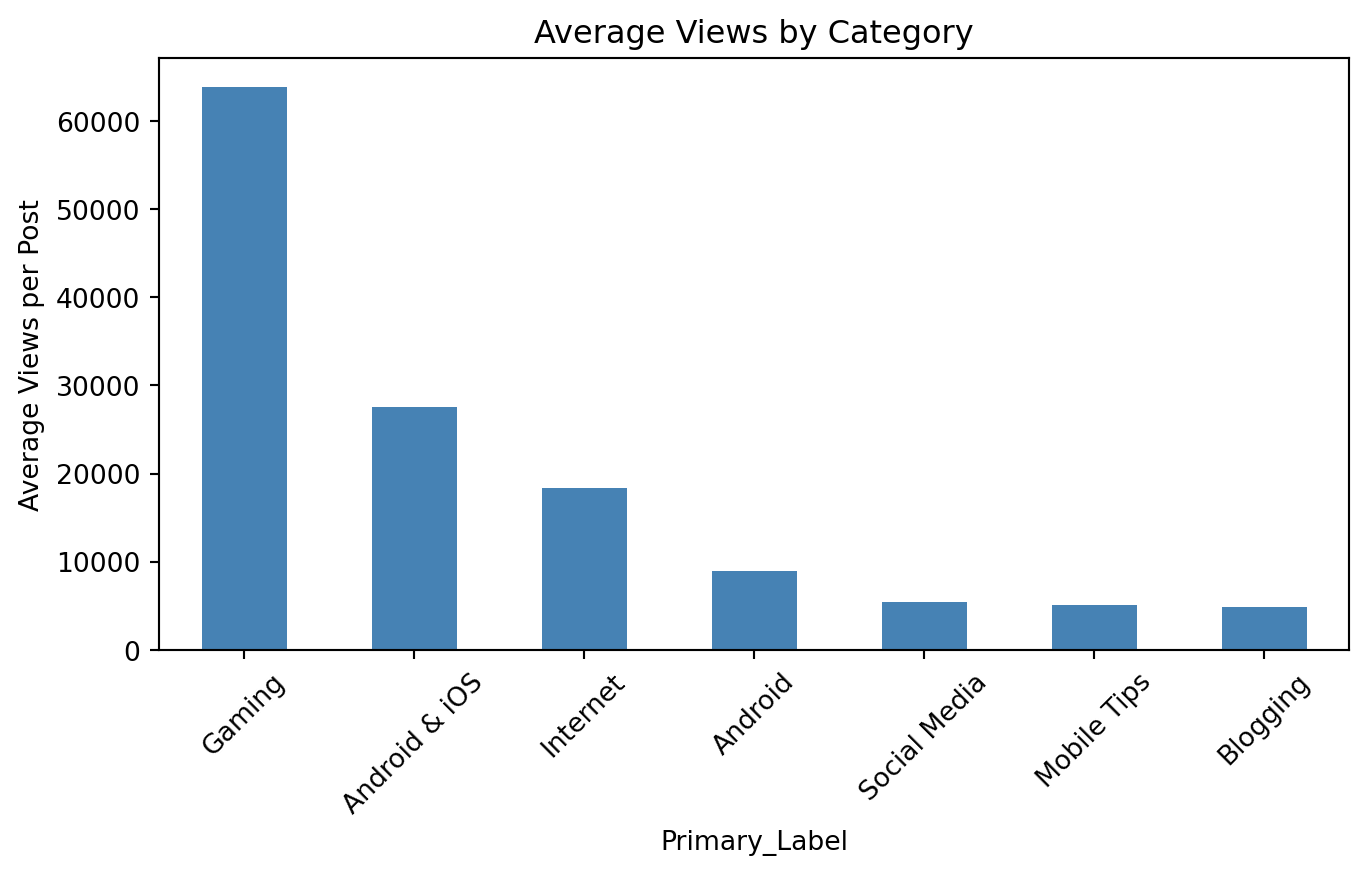
4.3.1 Insight
Posts about Android games and “Earn Money” tutorials gained substantially higher average views. In contrast, iOS and Social Media posts consistently underperformed.
4.4 Word Count vs. Views
Code
import seaborn as sns

sns.scatterplot(x='Word_Count', y='Views', data=df)
plt.title('Word Count vs. Views')
plt.xlabel('Word Count'); plt.ylabel('Views')
plt.grid(True)
plt.show()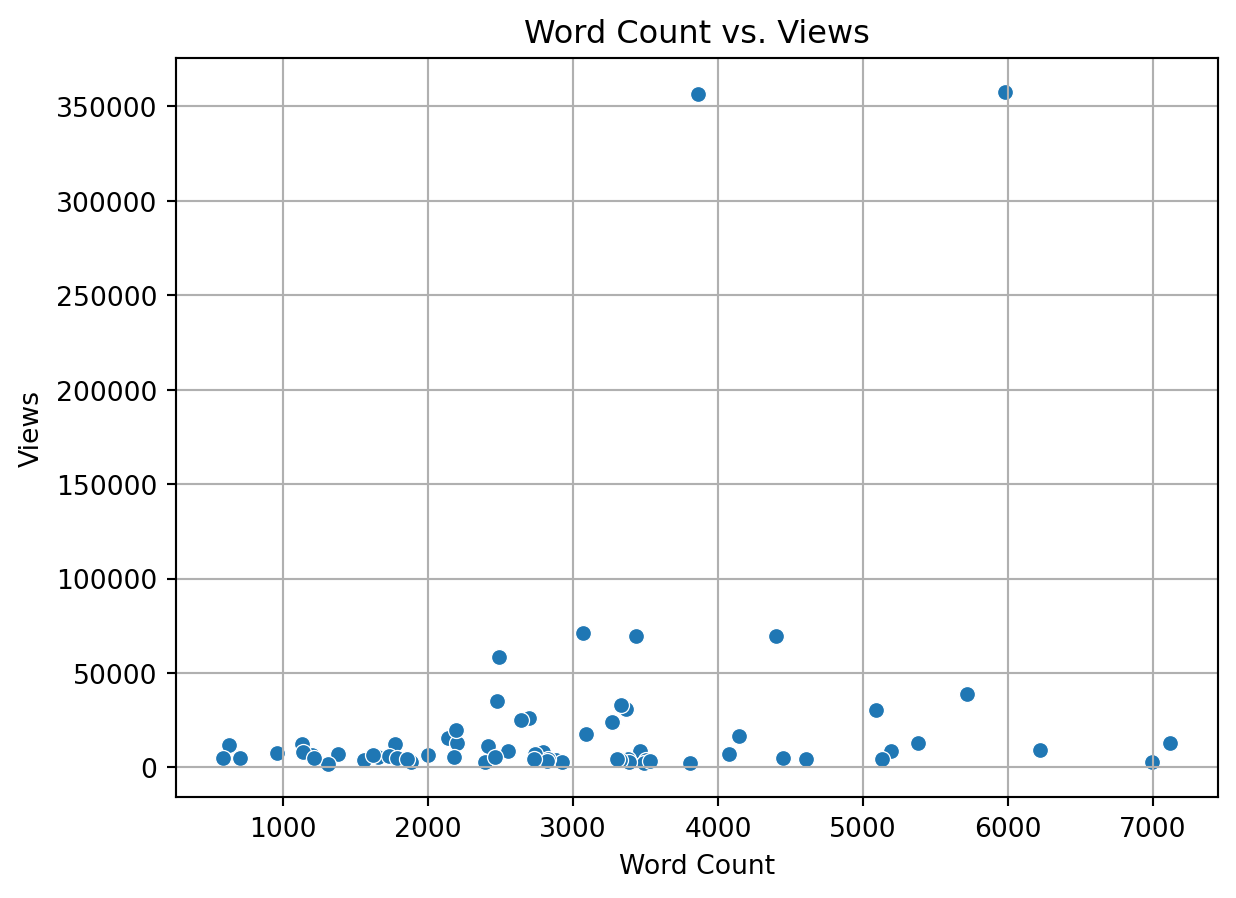
4.4.1 Observation
There’s no strong linear correlation between word count and views. It suggests topic popularity matters more than length — a key insight for content strategy.
5 Hypothesis Testing
We’ll now test a few hypotheses based on the observed patterns.
5.2 Hypothesis 2: Post length correlates with views
- \(H_0\): No correlation between word count and views
- \(H_1\): There is a correlation
Code
corr = df['Word_Count'].corr(df['Views'])
corr0.26046113392834486Interpretation:
The correlation coefficient indicates how strongly (or weakly) the length of a post influences its popularity. In this case, the correlation is expected to be weak — confirming that content topic > post length.
6 Key Findings
- Android gaming and “Earn Money” tutorials consistently outperformed all other topics.
- iOS-related and social media tutorials had notably low engagement.
- Views increased significantly after 2019, likely due to improved SEO and audience growth.
- Post length was not a major factor — trending keywords and timing mattered more.
7 Reflection
Analyzing my own blog data taught me that content creation and data analysis share a common principle — pattern recognition. The same curiosity that drove me to write about technology now drives me to explore data.
This marks the beginning of nafeesdata.me — a space where storytelling meets analytics.
